We are humans, we make mistakes – that’s very much true for coding.
Finding errors in our code is fundamental skill to train so we will cover here a few tools that help us find and fix errors more quickly.
12.1 What is a debugger?
A debugger is a device that allows us to interrupt code execution and jump into the execution context in a interactive mode, so that we can inspect and run code to find out what’s going on.
We called that to “set a breakpoint” or “set a trace”.
There are a few options to do that in python.
12.2 Python debugger, breakpoints
The python standard library includes pdb module. If you call this function in your code you will be put into an interactive session exactly at that point.
Any of the following options would work:
# your code# your codeimport pdbpdb.set_trace()# your code# your codebreakpoint()# your code# your code# your code
Once in the debugger, we have several functions to proceed with code execution with more granular control.
There are several options, but the most commonly used methods are:
n (next): Continue execution one line, stay in the current function (step over)
s (step): Execute current line and stop in a foreign function if one is called (step into)
c (continue): Continue whole code execution until a new breakpoint is found
12.3 IPython debugger
The standard python debugger is fine but a bit basic, so sometimes the IPython debugger is a friendlier option.
We need to install it:
uv add ipdb
Then we can do:
import ipdbipdb.set_trace()
12.4 Notebook %debug
Inside the jupyter notebook we can directly jump into a debugger when there is an error.
If a cell throws an error, you can type this “ipython magic method” in the following cell:
%debug
def wrong_func(): a =1assert a ==0wrong_func()
---------------------------------------------------------------------------AssertionError Traceback (most recent call last)
CellIn[1], line 5 2 a = 1 3assert a == 0----> 5wrong_func()CellIn[1], line 3, in wrong_func() 1defwrong_func():
2 a = 1----> 3assert a == 0AssertionError:
%debug
> /tmp/ipykernel_81865/3667203143.py(3)wrong_func() 1def wrong_func():
2 a = 1----> 3assert a == 0 4 5 wrong_func()
ipdb> print(a)
1
ipdb> exit
Notice that we typed “exit” to get out of the debugger.
12.5 Exercises
Here’s a piece of code that will fail at run-time:
def f(p):assert p ==0def main(): a =0 f(a) b =1 f(b) c =0 f(c)
Run the code to see the error
Set a breakpoint inside main to use the debugger
Step through the code using n (next) and another time using s (step)
Set a second breakpoint inside mainand run again the code but this time use c (continue)
Download this public dataset as zip file into the folder /pycourse/data/ (create it if you don’t yet have it)
Now, your collaborator has written this script to extract the mean value of the “SAR” entry from across all subjects bold data.
Put this script into the folder (create if it does not yet exist) pycourse/scripts/sar_mean.py and make the necessary modifications to make it run as a script.
import jsonfrom glob import globfrom pathlib import Pathdef get_subjects_sar_mean(data_dir):# Grab all files matching this filename pattern files = glob(str(data_dir/"**/*_bold.json"), recursive=True) sar_sum =0 n =0forfilein files: content = json.loads(Path(file).read_text()) sar_sum += content["SAR"] n +=1return sar_sum/n# TODO: add whatever code you need to make this code a proper script# that prints the sar-mean when run
Run it using uv run scripts/sar_mean.py and see it fail. Set a breakpoint inside the get_subjects_sar_mean function. Run it again and try to find the bug inside the debugger.
Add some error handling to make sure the script runs.
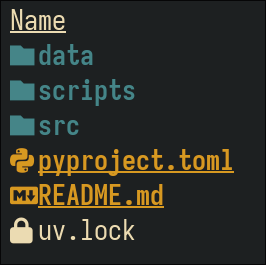
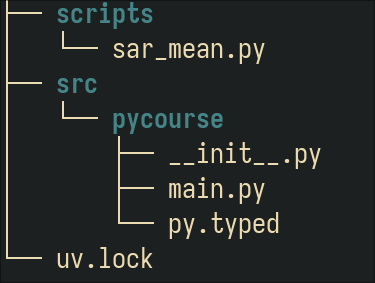
To recap, so far our project should look more or less like this: